Pharmacist compensation by state: how salaries differ across America: A data-based analysis
Pharmacist compensation by state shows how salaries differ across America, with reported figures shaped by geography, employer setting, scope-of-practice rules, and local workforce conditions. Available datasets use different years and measures, so the comparisons below distinguish BLS-based figures, estimated 2026 values, and salary-guide averages rather than treating every number as directly interchangeable. 1
National benchmarks and measurement differences
The national benchmark varies by source and methodology. BLS OEWS data reported a median annual pharmacist wage of $128,090 in 2022, while another BLS-based series lists $140,910 for 2025 and estimates $143,489 for 2026. A separate salary guide places the 2026 national median at $137,000, illustrating why a reported “average” may differ from a survey median or an inflation-adjusted estimate. 1 3 6
| Measure | Reported amount | Status or year |
|---|---|---|
| National median wage | $128,090 | 2022 BLS figure |
| National median annual salary | $140,910 | 2025 BLS-based figure |
| Current estimate | $143,489 | 2026 estimate |
| Salary-guide median | $137,000 | 2026 guide |
Highest reported state salaries
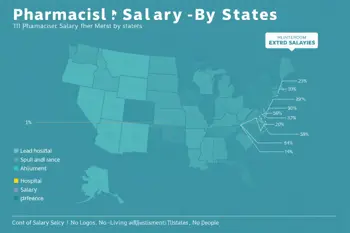
California, Alaska, and Oregon appear consistently near the top of the supplied state comparisons, although the exact ordering depends on the dataset. One 2026 table lists California at $155,000, Alaska at $145,580, and Oregon at $138,630. Another reports California at $165,000, Alaska and Oregon at $163,000, and Washington at $157,000. These differences reflect distinct collection methods, definitions of average or median, and publication dates. 2 3
- California: $155,000 in one salary table and $165,000 in another.
- Alaska: $145,580 in one table and $163,000 in another.
- Oregon: $138,630 in one table and $163,000 in another.
- Washington: $137,570 in one table and $157,000 in another.
- Minnesota: $132,850 in one table and $155,000 in another.
Regional patterns in pharmacist compensation
The supplied data shows a broad Pacific and northern pattern of higher reported pay, including California, Alaska, Oregon, Washington, Minnesota, Maine, Wisconsin, Vermont, and New Hampshire. Southern states frequently appear closer to or below the national benchmark. In a BLS-based Southeastern comparison using 2022 data, Virginia had the region’s highest annual mean wage at $130,350, while West Virginia recorded $119,000 and Arkansas $120,440. 2 4
| State | Annual mean wage in Southeastern comparison |
|---|---|
| Virginia | $130,350 |
| North Carolina | $128,330 |
| Alabama | $125,820 |
| Florida | $121,560 |
| Arkansas | $120,440 |
| West Virginia | $119,000 |
Cost of living and purchasing power
Gross salary is only one part of compensation analysis. A LinkedIn summary of BLS-based figures reported Minnesota as the leading state after cost-of-living adjustment, with mean adjusted hourly wages increasing from $71.10 in 2024 to $74.74 in 2025. This illustrates why a lower nominal salary in a Midwestern market can produce purchasing power comparable to, or greater than, a higher coastal salary after housing and other local expenses are considered. 5
- Nominal pay measures the stated annual wage before taxes and personal deductions.
- Cost-of-living-adjusted pay accounts for differences in local purchasing power.
- State taxes can alter take-home compensation even when two salaries are identical.
- Housing, transportation, and household composition affect an individual comparison.
Employer setting, specialty, and experience
Pharmacist compensation also varies by work setting. The supplied salary ranges place retail pharmacists around $125,000 to $135,000, hospital and clinical pharmacists around $130,000 to $150,000, and specialty pharmacists around $145,000 to $175,000. Pharmacy directors are listed at $160,000 to $220,000. These are category ranges rather than guarantees, and individual pay can differ with experience, certifications, residency training, workload, and the employer’s local market. 3
| Role or setting | Reported annual range |
|---|---|
| Retail pharmacist | $125,000 to $135,000 |
| Hospital or clinical pharmacist | $130,000 to $150,000 |
| Specialty pharmacist | $145,000 to $175,000 |
| Pharmacy director | $160,000 to $220,000 |
Regulation, workforce supply, and practical limitations
State-level labor conditions help explain why compensation differs. The research identifies pharmacist shortages, remote-area recruitment incentives, union presence, healthcare infrastructure, and scope-of-practice rules as influences on pay. Pharmacists may also pursue board certifications such as BCPS, BCOP, BCNSP, BCCCP, or BCIDP for specialized roles. However, eligibility requirements, licensure rules, residency expectations, and continuing professional obligations can limit access to particular positions. 1 7
Salary comparisons should therefore be treated as historical or estimated market indicators, not employment guarantees. The data combines BLS survey results, salary-guide estimates, and other reported summaries that use different years and statistical definitions. A sound comparison checks the specific metropolitan area, practice setting, schedule, benefits, taxes, credential requirements, and workload before drawing conclusions about which state offers the strongest overall compensation. 1 2 4
Sources
- Pharmacist Salary, “Pharmacist Salary by State (2026)”: pharmacistwages.com
- Wealthvieu, “How Much Do Pharmacists Make in 2026?”: wealthvieu.com
- SalaryByState, “Pharmacist Salary 2026”: salarybystate.com
- Health Guide USA Commentary, “Pharmacist Pay in the Southeastern U.S.”: healthguideusa.org
- Kevin Mero, “Pharmacist pay by state, adjusted for cost of living”: LinkedIn
- ZipDo, “Pharmacist Statistics: 2026 Fact-Checked Report”: zipdo.co
- Bureau of Labor Statistics, “Pharmacists”: bls.gov
Authored by 24Trendz team