Occupational therapist salaries by state: regional differences across the United States: A Data-Based National Comparison
Occupational therapist salaries by state reveal clear regional differences across the United States. Available 2025 and 2026 estimates place national median pay between $98,340 and $103,400 annually, while state and metropolitan figures show how geography, demand, employer type, and living costs influence compensation. 1
National salary benchmarks and data limits
The latest figures provide several reference points rather than one universal salary number. PathScorer reports a 2026 national median of $98,340, with wages ranging from $67,090 at the 10th percentile to $129,830 at the 90th percentile. Occupational Therapist Pay estimates a 2026 median of $103,400 by applying a 3.06% growth rate to BLS OEWS data through 2025. 2
The underlying series reported by Occupational Therapist Pay lists actual median wages of $84,950 in 2019, $93,180 in 2022, $96,370 in 2023, $98,340 in 2024, and $100,330 in 2025. The 2026 and 2027 values are identified as estimated and projected rather than observed BLS results, so comparisons should distinguish published survey data from modeled figures. 1
Pacific and Western regional patterns
The Pacific and Western states dominate the upper end of state salary tables. PathScorer places California first at $119,470, followed by Oregon at $106,840, Nevada at $104,770, and Colorado at $103,970. Washington is listed at $102,360, Arizona at $102,220, and Alaska at $100,070. These results support a broad pattern of stronger nominal compensation in parts of the West. 2
Higher wages in Western metropolitan areas do not automatically translate into greater financial flexibility. SalaryMetro reports median metropolitan pay of $130,696 in San Jose, $128,133 in San Francisco, $117,302 in Seattle, and $105,257 in Denver, but its cost-of-living-adjusted figures are $72,690, $75,684, $78,410, and $88,899 respectively. The comparison shows why housing and regional expenses must be evaluated alongside salary. 3
| State or metro area | Reported median salary |
|---|---|
| California | $119,470 |
| Oregon | $106,840 |
| Nevada | $104,770 |
| San Jose, California | $130,696 |
| Seattle, Washington | $117,302 |
Northeast and Mid-Atlantic compensation
The Northeast and Mid-Atlantic present a mixed but generally competitive picture. The reported state medians include $103,340 in New Jersey, $102,080 in Connecticut, $101,880 in Maryland, $100,540 in Virginia, and $99,150 in Rhode Island. Massachusetts appears near the national midpoint at $98,420, while New York is reported at $95,370. 2
Metro-level figures can exceed statewide medians because large healthcare markets concentrate specialized employers and higher-paying institutions. SalaryMetro lists Boston at $113,759, New York at $112,817, and Washington, DC, at $112,675. Its adjusted values are lower at $76,657, $87,659, and $80,425, illustrating that a high metropolitan wage may coexist with substantial housing and transportation costs. 3
- New Jersey: $103,340 median
- Connecticut: $102,080 median
- Maryland: $101,880 median
- New York: $95,370 median
- Massachusetts: $98,420 median
Midwest and Southern state differences
Several Midwestern and Southern states cluster around or below the national median, although the pattern is not uniform. Reported medians include $98,900 in Illinois, $97,000 in Kansas, $95,880 in Ohio, $93,500 in Indiana, $93,600 in Missouri, and $87,283 in Iowa. Southern figures include $101,760 in Texas, $99,070 in Florida, $98,690 in Georgia, $95,410 in Alabama, and $92,330 in Mississippi. 2
These figures demonstrate why regional labels alone are insufficient. Texas combines a reported median above $100,000 with large metropolitan labor markets, while Iowa and Mississippi appear much lower in the same dataset. Employer mix, urban concentration, specialty availability, and the number of surveyed workers can affect state results, particularly where occupational therapist employment is less concentrated. 1
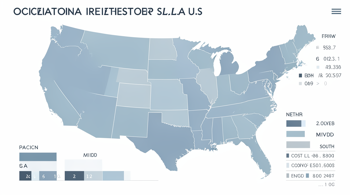
| Region | Selected state medians |
|---|---|
| Midwest | Illinois $98,900; Ohio $95,880; Indiana $93,500; Iowa $87,283 |
| South | Texas $101,760; Florida $99,070; Georgia $98,690; Mississippi $92,330 |
Lower-ranked states and rural compensation factors
The lower end of the state rankings includes North Dakota at $85,549, Iowa at $87,283, Maine at $88,039, and New Hampshire at $89,507. Puerto Rico is listed separately at $55,652 and is not one of the 50 states. Such figures describe reported medians, not guaranteed individual earnings, and should not be interpreted as a complete measure of total compensation or professional opportunity. 1
Rural labor markets may offset lower nominal wages through recruitment incentives, loan-forgiveness programs, signing payments, or other employment benefits, according to the supplied research summary. Those arrangements can narrow the practical gap between rural and urban roles, but eligibility requirements, service commitments, employer participation, and local workforce shortages determine whether an individual qualifies. 4
Purchasing power, experience, and practice setting
Cost of living is one of the most important qualifications to a state salary comparison. SalaryMetro reports a national metropolitan median of $96,603, with a 10th-percentile figure of $62,850 and a 90th-percentile figure of $139,399. Its comparison shows that San Jose's $130,696 nominal salary falls to $72,690 after adjustment, while Denver's $105,257 becomes $88,899. 3
Experience and workplace setting also create variation inside each state. SalaryMetro reports a $96,603 median across its metro sample, while the supplied research identifies hospitals, home health, schools, years of experience, metropolitan status, and certifications as major influences. Specialty work may raise compensation by 20% to 32% in some summaries, but the amount depends on local demand, credentials, caseload, and the employer's pay structure. 5
What salary comparisons should examine
- Whether the figure is a median, mean, estimate, or projection.
- Housing, transportation, taxes, and other regional living costs.
- Benefits, retirement contributions, paid leave, and recruitment incentives.
- Experience requirements, certifications, specialty expectations, and service obligations.
- Whether the role is hospital-based, school-based, outpatient, home health, or contract work.
Demand, oversight, and practical market friction
Occupational therapy compensation is influenced by workforce demand, but demand does not remove labor-market constraints. The supplied research identifies projected employment growth, healthcare staffing shortages, and regional differences in provider supply as factors that can support stronger starting salaries. At the same time, private equity consolidation, technology-assisted care, telehealth, and the use of occupational therapy assistants are changing how services are delivered. 6
Salary figures also require regulatory and professional context. Occupational therapists must satisfy state licensure rules, employer credentialing standards, and any continuing education or specialty requirements applicable to their role. Compensation comparisons should therefore review eligibility, workload, productivity expectations, supervision arrangements, benefits, and contract terms rather than relying on a headline median alone. Geographic pay differences are meaningful, but purchasing power and working conditions determine the practical value of an offer. 4
Sources
- Occupational Therapist Pay, Occupational Therapist Salary by State, https://occupationaltherapistpay.com/salary/
- PathScorer, Occupational Therapist Salary, https://pathscorer.com/salary/occupational-therapist-29-1122.00
- SalaryMetro, Average Occupational Therapist Salary, https://salarymetro.com/salary/occupational-therapist/
- Bureau of Labor Statistics, Occupational Employment and Wage Statistics, https://www.bls.gov/oes/current/oes291122.htm
- The Salary Insights, Occupational Therapist Salary USA 2026, https://www.thesalaryinsights.com/occupational-therapist-salary/
- IBISWorld, Occupational Therapists in the US Industry Analysis, https://www.ibisworld.com/united-states/industry/occupational-therapists/5872/
Authored by 24Trendz team