Where medical sonographers earn the most: U.S. salary comparison by state: A data-based national review
Where medical sonographers earn the most: U.S. salary comparison by state is shaped by more than a single national ranking. Reported wages vary by dataset, metropolitan area, specialty credential, licensing environment, employer type, and local cost of living. The figures below describe market averages and broad compensation patterns rather than guaranteed earnings for any individual worker.
How the national salary figures compare
The Bureau of Labor Statistics Occupational Employment and Wage Statistics data reported a national median annual wage of $89,340 for diagnostic medical sonographers in May 2024, while another state comparison presents a $84,470 national median using its own BLS-based table. 4 The difference illustrates why salary comparisons should identify the reporting year, measure used, and occupation definition before states are ranked.
A separate series lists BLS actual national median wages rising from $74,320 in 2019 to $96,590 in 2025, with a 2026 estimate of $101,352 based on a 4.93% historical compound annual growth rate. 1 The 2026 figure is therefore an estimate, not a finalized government wage observation. Employer, experience, certification, shift, and local market conditions can all produce results above or below a state median.
States appearing most often near the top
California consistently appears among the highest-paying states. One BLS-based table reports a California median of $109,810, a 90th-percentile wage of $153,990, and 9,936 employed sonographers. 2 Another 2026 ranking places California first at an estimated $138,355 average median salary, demonstrating that the state’s position is stable even though the exact figure changes with methodology.
Other frequently cited high-compensation states include Hawaii, Oregon, Washington, Alaska, Massachusetts, Connecticut, New York, and Colorado. A separate ranking lists Hawaii at $122,000, California at $121,000, Oregon at $108,000, Washington at $107,000, Colorado at $105,000, Massachusetts at $104,000, and Alaska at $103,000. 5 These values should be read as comparative indicators rather than one uniform national table.
Illustrative high-paying state comparison
| State or market | Reported figure | Relevant context |
|---|---|---|
| California | $109,810 median | High wages and large metropolitan employment base |
| Hawaii | $122,000 median | High compensation alongside high living costs |
| Oregon | $108,000 median | Portland and state licensure influence |
| Washington | $107,000 median | Seattle market and no state income tax |
| Massachusetts | $104,000 average | Boston academic medical centers |
The table combines figures from different supplied research pages, so it is not a single harmonized ranking. California’s state table reports a $109,810 median, while the separate state-ranking dataset reports $121,000 for California and $104,000 for Massachusetts. 2 Such variation can reflect mean versus median wages, different survey years, updated estimates, and differing treatment of metropolitan areas.
Metropolitan concentration is especially important. The research identifies San Jose, Sunnyvale, and Santa Clara as a market where annual mean wages can exceed $140,000, while coastal academic and hospital systems in California, Washington, Massachusetts, and New York are associated with elevated compensation. 7 A statewide average can therefore conceal substantial differences between a major medical center, a suburban outpatient facility, and a rural hospital.
Nominal pay versus purchasing power
High salaries do not automatically produce the strongest household purchasing power. In the supplied comparison, California’s $109,810 median is adjusted to $96,494 using a cost-of-living index of 113.8. 2 This adjustment does not measure personal financial outcomes, because housing, commuting, family size, benefits, and tax circumstances differ, but it shows why nominal rankings can overstate the practical advantage of expensive coastal markets.
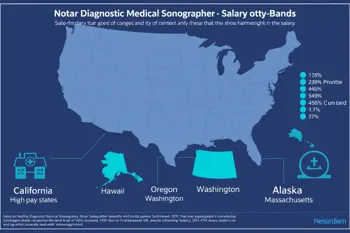
Alaska, Hawaii, Washington, Nevada, and Texas are described as having no state income tax, while Massachusetts is listed with a 5% state income tax and Indiana with a 3.05% rate. 3 Tax treatment is only one factor. Housing costs, transportation, healthcare access, geographic isolation, and the availability of specialized employers may offset or amplify a posted salary. A comparison should therefore consider both gross pay and living conditions.
Credentials, specialties, and licensing
Pay differences also occur within the diagnostic medical sonographer occupation. The supplied research links higher compensation to ARDMS specialties including abdomen, obstetrics and gynecology, vascular, adult and pediatric echocardiography, musculoskeletal, and breast imaging. Cardiac sonography is described as a specialty market commonly reaching $95,000 to $120,000 or more. 3 Specialty credentials may expand access to assignments that general salary tables do not distinguish.
State regulation can affect eligibility and mobility. The research specifically identifies Oregon, New Mexico, New Jersey, and New Hampshire as states with sonographer licensure requirements or licensing considerations. 3 Credentialing, examination preparation, employer requirements, and any applicable state rules create ongoing professional obligations. A high advertised wage is not meaningful if a candidate cannot satisfy the credential or licensure conditions attached to the role.
Employment outlook and market friction
The BLS-based research reports approximately 84,200 workers in the occupation and projects 13% employment growth from 2024 to 2034. 4 Another supplied dataset reports 86,460 workers and 10% growth for 2022 to 2032, again showing that totals depend on the reference period and methodology. Growth can support long-term demand, but it does not guarantee that every state or specialty will have the same number of openings.
Recruiter observations indicate that sonography requisitions declined by more than 30% among surveyed clients during the referenced period, with newly trained sonographers facing increased difficulty finding full-time roles in California, Florida, Nevada, and Ohio. 8 This market friction is important because a high state average may coexist with selective hiring, fewer openings, or competition among new graduates. Rural markets may retain different staffing conditions from large urban centers.
How to interpret a state salary comparison
State wage tables are most useful for identifying broad patterns, not predicting an exact paycheck. Median wages describe the midpoint, while the 10th and 90th percentiles indicate the lower and upper boundaries of the typical reported distribution. 4 Experience, specialty, employer setting, shift differentials, location, and certification can move compensation substantially within the same state.
The most defensible comparison uses several checks: confirm the survey year, distinguish mean from median, review metropolitan differences, account for cost of living and taxes, and verify licensing requirements. California and Hawaii often lead nominal rankings, while Oregon, Washington, Alaska, Massachusetts, Connecticut, New York, and Colorado also appear repeatedly near the upper tier. 5 The final decision remains sensitive to employment availability and professional eligibility.
Sources
- Sonographer Pay, Diagnostic Medical Sonographer Salary by State
- Pay by State, Diagnostic Medical Sonographer Salary by State
- Sonographer Pay, Highest Paying States for Diagnostic Medical Sonographers
- Ultrasound Degree, Sonographer Salary by State
- Salary by State, Diagnostic Medical Sonographer Salary by State
- Homebase, Each State's Highest-Paying Hourly Jobs
- U.S. Bureau of Labor Statistics, Occupational Employment and Wage Statistics
- RSG Health Services, Year-End Medical Imaging Jobs Update
Authored by 24Trendz team