Heavy Truck Driver pay rates by state: A data-based market analysis
Heavy truck driver pay rates by state show a wide geographic spread, with Alaska, Washington, New Jersey, New York, and California frequently appearing near the upper end of published salary tables. Lower reported averages are concentrated in several Southern states, although the exact ranking changes according to the data year and whether the source measures mean pay, median pay, or broader CDL employment. 1
National pay context
National estimates provide a benchmark, but they are not interchangeable. One 2025 compilation based on Bureau of Labor Statistics Occupational Employment and Wage Statistics reports an average of $59,710 and a median of $58,640. Another 2024-oriented guide reports a median of $57,440, a mean of $58,400, and a 90th-percentile wage above $78,800. A separate 2026 salary guide places the company-driver median near $54,320. 2
The differences reflect methodology as much as changing labor conditions. Heavy and tractor-trailer drivers may be grouped with broader truck-driver categories, while one source may capture employees and another may discuss company drivers, specialized freight, or owner-operators. Consequently, a state figure should be treated as a market reference rather than a guaranteed paycheck. Gross annual figures also exclude taxes, unpaid waiting time, benefits differences, and operating expenses. 3
States with higher reported averages
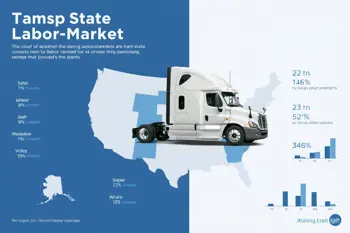
Alaska leads several supplied comparisons, reported at $67,600 in one 2026 table and $69,520 in a separate 2025 BLS-based ranking. Washington appears at $61,360 in the same 2026 table and $68,230 in the other ranking. New York is listed at $63,440 and $65,780, while New Jersey is listed at $62,400 and $66,770. These discrepancies illustrate why the publication date and occupational definition should accompany every wage comparison. 1
| State | Reported annual average | Source table |
|---|---|---|
| Alaska | $67,600 to $69,520 | 2025 to 2026 comparisons |
| Washington | $61,360 to $68,230 | 2025 to 2026 comparisons |
| New York | $63,440 to $65,780 | 2025 to 2026 comparisons |
| New Jersey | $62,400 to $66,770 | 2025 to 2026 comparisons |
States with lower reported averages
At the lower end of the supplied state tables, Mississippi is reported at $44,200, Arkansas and West Virginia at $45,760, and Alabama and Kentucky at $46,800. A different compilation identifies Louisiana at $51,930 as its lowest state value, while Geotab reports Mississippi at $51,330. The spread demonstrates that these figures should not be presented as a single definitive ranking without identifying the source and year. 4
Lower nominal pay does not automatically mean lower economic value. Cost of living can materially change purchasing power. In the FreeFinCalc comparison, Wyoming has a nominal salary of $61,360 but a cost-of-living-adjusted figure of $64,589, while California has a nominal $65,000 but an adjusted $45,775. Hawaii shows an even sharper contrast, with $54,600 nominal pay and $28,737 after adjustment. 1
Cost of living and regional value
The supplied adjusted figures place Wyoming and North Dakota near the top of the value comparison at $64,589 and $64,301, followed by Illinois at $60,387, Ohio at $57,258, and Texas at $57,032. These results differ from the nominal ranking because the adjustment incorporates reported state cost-of-living indexes. For example, Texas has a nominal salary of $53,040, below several coastal states, but its adjusted figure is higher because its listed cost-of-living index is 93. 1
- Washington: $61,360 nominal and $53,357 adjusted.
- New Jersey: $62,400 nominal and $51,570 adjusted.
- Massachusetts: $59,800 nominal and $44,296 adjusted.
- Minnesota: $54,600 nominal and $56,289 adjusted.
How job type changes compensation
State averages conceal major differences among driving assignments. The supplied pay data describes dry-van OTR work at roughly $65,000 to $80,000, reefer work at $70,000 to $92,000, flatbed work at $72,000 to $95,000, petroleum tanker work at $74,000 to $95,000, and hazmat work at $75,000 to $96,000. LTL employment is listed at $68,000 to $85,000. These are category ranges, not guaranteed state wages. 6
Pay structure also varies by operating pattern. OTR and regional company drivers are commonly paid by the mile, with a cited 2026 range of $0.45 to $0.65 per mile, while local and LTL drivers are more often paid hourly at approximately $22 to $32. Sign-on bonuses are reported in the $5,000 to $15,000 range by one guide, but compensation comparisons should include eligibility rules, retention requirements, mileage definitions, detention treatment, and benefits rather than focusing on advertised headline amounts. 8
Experience, eligibility, and financial risk
Experience strongly affects expected earnings. One 2026 overview places entry-level annual gross pay at $38,000 to $44,000, experienced OTR pay above $70,000, and the top 10 percent above $80,000. Another source reports a 10th-percentile wage of $38,640 and a 75th-percentile wage of $69,100. CDL qualification is central to these roles, while specialized assignments may require additional qualifications such as hazmat eligibility. 3
Owner-operator figures require particular caution because gross revenue is not personal income. The supplied research lists gross owner-operator revenue at $150,000 to $220,000, but net income at $55,000 to $90,000 after expenses. Fuel, maintenance, insurance, equipment financing, and periods without suitable freight can reduce the final amount. Company-driver comparisons should therefore separate wage income from business revenue and account for market friction, operating downtime, and risk allocation. 6
How to interpret state pay tables
A responsible comparison should identify whether a figure is a mean or median, which year it represents, and whether it covers heavy and tractor-trailer drivers specifically or a broader truck-driver category. The BLS-based sources use occupational wage data, while industry guides may combine salary trackers, carrier information, and category estimates. Employment scale also matters: the cited Mappr table lists 63,700 drivers in New York, 47,980 in New Jersey, and 3,420 in Alaska, so a high average in a small market does not indicate the same number of opportunities as a large freight state. 2
State pay is influenced by freight demand, port and logistics activity, route length, cargo type, seniority, union status, and private-fleet versus for-hire employment. Private-fleet drivers are described as potentially earning more than drivers at for-hire carriers, but individual compensation still depends on the employment agreement and workload. The most useful reading of a state table is therefore comparative: it identifies broad wage patterns while leaving room for employer, route, qualification, tax, and cost-of-living differences. 5
Sources
- FreeFinCalc, Average Truck Driver Salary by State 2026
- Mappr, Truck Driver Salary by State 2025
- SalaryClear, Truck Driver Salary 2026
- Geotab, Truck Driver Salary: 2025 Guide to Pay by State and Job Type
- General research references including U.S. Bureau of Labor Statistics and CareerOneStop
- FillTheRig, Truck Driver Salary Guide 2026
- Trade Schools Directory, Company Driver vs. Owner-Operator
- O Trucking, Company Driver Salary Guide 2026
Authored by 24Trendz team